
February 06, 2020
February 03, 2020
Nitrogen Response, Uptake and Use Efficiency of Spring Wheat Cultivars


One of the most common questions asked by wheat producers is how to manage nitrogen (N) fertilizer depending on what variety they chose to grow. Previous work has shown that wheat cultivars may vary in N requirements, N uptake, and N use efficiency (NUE).
One of the main reasons why many producers like to plant older varieties is the fact that they are very familiar with them, even though they may be substantially lower yielding, may not have the best grain quality and may not perform as well under various biotic and abiotic stresses associated with disease, water or nutrient limitations or pest or weed pressure.
Increasing the knowledge about newly released varieties will help to improve the adaption of these varieties by growers.
The following data were collected from the research area (a dedicated 0.2 m2 section within each plot) at Feekes 5, and Feekes 10:
- plant height (by measuring height of 10 randomly selected plants per plot)
- chlorophyll content estimate (using SPAD meter)
- biomass production estimate- as Normalized Difference Vegetative Index (NDVI, using GreenSeeker handheld optical sensor)
- biomass weight (by hand-harvesting all above ground biomass within the 0.2 m2 area)
- biomass N content (laboratory analysis)
- biomass N content and final grain yield were estimated using multispectral camera mounted on a UAV
The performance of each variety was evaluated using multispectral camera mounted on a UAV
At maturity, the following data was obtained:
crop yield – preliminary results are reported in Figure 1.
grain nutrient content (grain will be analyzed for N content) – newly purchased Perten Grain Analyzer will be utilized.
Wheat grain quality will be assessed: 1) baking quality analysis (mixing time, water absorption, loaf volume, crumb grain score), 2) solvent retention capacity (SRC) will be carried out at the University of Idaho Wheat Quality Lab, 3) viscosity (Hageberg Falling Number test) will be performed at the Aberdeen R&E Center lab.
OBJECTIVES:
- To assess response of newest University of Idaho, other best-performing wheat cultivars, and traditional “check” varieties to N, to quantify their N uptake magnitude and its’ pattern throughout the growing season, and NUE, and
- To evaluate N uptake and NUE of spring wheat varieties currently tested in extension nurseries using ground- and aerial-based data.


Nutrient Management for Wheat
Improving Nutrient Management for Wheat
through Comprehensive Soil and Crop Survey
Olga S. Walsh, and Jordan R. McClintick-Chess, University of Idaho, Plant Sciences Department
Sanaz Shafian,University of Idaho, Department of Soil and Water Systems,
Juliet Marshall,University of Idaho, Department of Entomology, Plant Pathology and Nematology


Soil testing is a necessary component of successful and sustainable soil nutrient management for crop producers. Proper soil testing is essential to ensure optimal fertilizer usage resulting in maximum economic and agronomic returns with minimal environmental impact.
Local growers, extension educators, and crop consultants have expressed the need for enhancing their knowledge of sustainable soil nutrient management by boosting their understanding of soil sampling/testing. Despite substantial educational efforts, many growers do not test their soil’s fertility on a regular basis. This is especially true for many wheat growers in southern Idaho, where other crops such as potatoes produce the highest revenue, and nutrient management for wheat is often overlooked.
Improving grower understanding of on-farm soil fertility and soil residual nutrient levels as well as being aware of what kind of response can be expected from N and P fertilizer application are key to making informed and wise nutrient management decisions.
OBJECTIVE: To illustrate response of wheat to N and P fertilizer.

Nitrogen (P) and phosphorus (P) response plots were established at the University of Idaho Parma R&E Center. On April 3, 2019, soft white spring wheat (Seahawk) was planted with H&N Equipment small plot drill using 276 plants m2 seeding rate. At planting, 5 N 5 P levels were applied, each treatment was replicated 3 times. The research plots were hand-harvested on August 22, 2019, and data on wheat biomass and grain production was analyzed. Grain production was calculated as a product of kernels head-1 and kernel weight. The Duncan's Multiple Range Test was used in the SAS 9.4 statistical software to determine the differences between treatments at the 95% confidence level.


In general, plant height increased with increased N rates. Plant height was optimized at 250 lb N ac-1, increasing N rate to 300 lb ac-1 did not further enhance plant height.
Biomass production (weight), number of wheat heads 3 ft-1, kernels head-1, kernel weight, and grain production was maximized with 300 lb N ac-1.
No statistically significant differences were associated with any other N rates.
All assessed wheat biomass and grain parameters, including kernels head-1, kernel weight, and grain production were numerically greater at 150 ppm P.
All evaluated P rates were not statistically significantly different for any of the assessed wheat biomass and grain parameters.
Positive linear relationship was observed for biomass weight and plant height with wheat grain production.
Nitrogen & Water Management for Sugar Beets


Nitrogen and Water Management for Optimized
Sugar Beet Yield and Sugar Content
Olga S. Walsh, and Jordan R. McClintick-Chess, University of Idaho, Plant Sciences Department
Sanaz Shafian, University of Idaho, Department of Soil and Water Systems
Sugar beet (SB) production profitability is based on maximizing three parameters: beet yield, sucrose content, and sucrose recovery efficiency. Efficient nitrogen (N) and water management are key for successful SB production. Nitrogen deficits in the soil can reduce root and sugar yield. Overapplication of N can reduce sucrose content and increase nitrate impurities which lowers sucrose recovery. Application of N in excess of SB crop need leads to vigorous canopy growth, while compromising root development and sugar production.
Changes in SB varieties and management practices warrant re-evaluation of N management. The Amalgamated Sugar Company and the USDA-ARS found that in 60% of evaluated SB fields, application of N did not increase sucrose yield. This suggests that residual soil N from past applications and in-season N mineralization was adequate and indicates that growers could maximize sugar yield and save money by applying less N. Due to recommendation to have all N applied and plant-available by 4-6 leaves, it is imperative to determine the appropriate N application rates for N responsive fields early in the season. Appropriate irrigation amount and timing can optimize SB yields while minimizing disease pressure, water costs and N leaching. Excessive irrigation can increase SB root weight, but lower sugar content.
OBJECTIVE: To analyze the effects of water and N fertilizer rates on yield and quality.


Location: Parma R&E Center; SB variety: BTS 2570;
Planting: April 2019; 5 inch seed spacing; 0.75 inch seeding depthPlots: 4 rows per plot with 22 inch row spacing; 40 ft long at planting, 35 ft at harvest (cut 5 ft alleys between replications)
Treatment set-up: Split split-plot design with 4 replications; 4 blank rows between the plots to minimize water and/or N carryover
Nitrogen: 100, 200, and 300 lb N/ac (total: soil residual + added fertilizer); applied as urea (46-0-0) and incorporated into the soil immediately prior to planting using light tillage
Water: 100% ET and 50% ET; applied using subsurface drip irrigation system (7-inch depth). Daily reference grass-based ET (ETo) were calculated using data from the Parma AgriMet weather stations. Daily ETc was estimated by multiplying ETo by the SB crop coefficient (Kc).
Data collection: at 40 and 60 days after planting, and prior to harvest: 1) Plant height - 15 plants per plot; top leaf to the soil; 2) Plant dry matter determination (oven-dried at 220◦F for 24 h and weighed) and N content – 15 leaves and tops (0.8 in of taproot).
Harvest: In October, SB were scalped to a silver dollar sized disc and harvested for yield and root sugar content determination.


Biomass dry weight increased from early to mid-season as plants grew and developed. Early season biomass production was lower for 100 N treatments (50 and 100 ET); all treatments with higher N and water were statistically equal. Mid-season biomass increased as N and water inputs increased, with slight decline beyond 300 N + 50 ET.
Biomass N content early season was increased with higher N rates, and were comparable for 50 and 100 ET. N content declined throughout the growing season, as the taken up N got distributed among the developing plant biomass volume. Mid and late season biomass N content was comparable for all treatments.
Sugar beet root yield was maximized with 200 N + 100 ET treatment. Increasing N rate to 300 kg ha-1 did not enhance yield at 50 or at 100 ET level. Lower water inputs significantly reduced yield, especially at lower N rate. Lowest yield was obtained with lowest N + water input.
Sugar content was higher for 50 ET treatments, irrespective of N rate. Sugar content was lowest at 100 N + 100 ET, and maximized with 200 N + 50 ET treatment. Sugar content for 100 N + 50 ET was comparable to that of 200 N and 300 N treatments watered at 100 ET level.
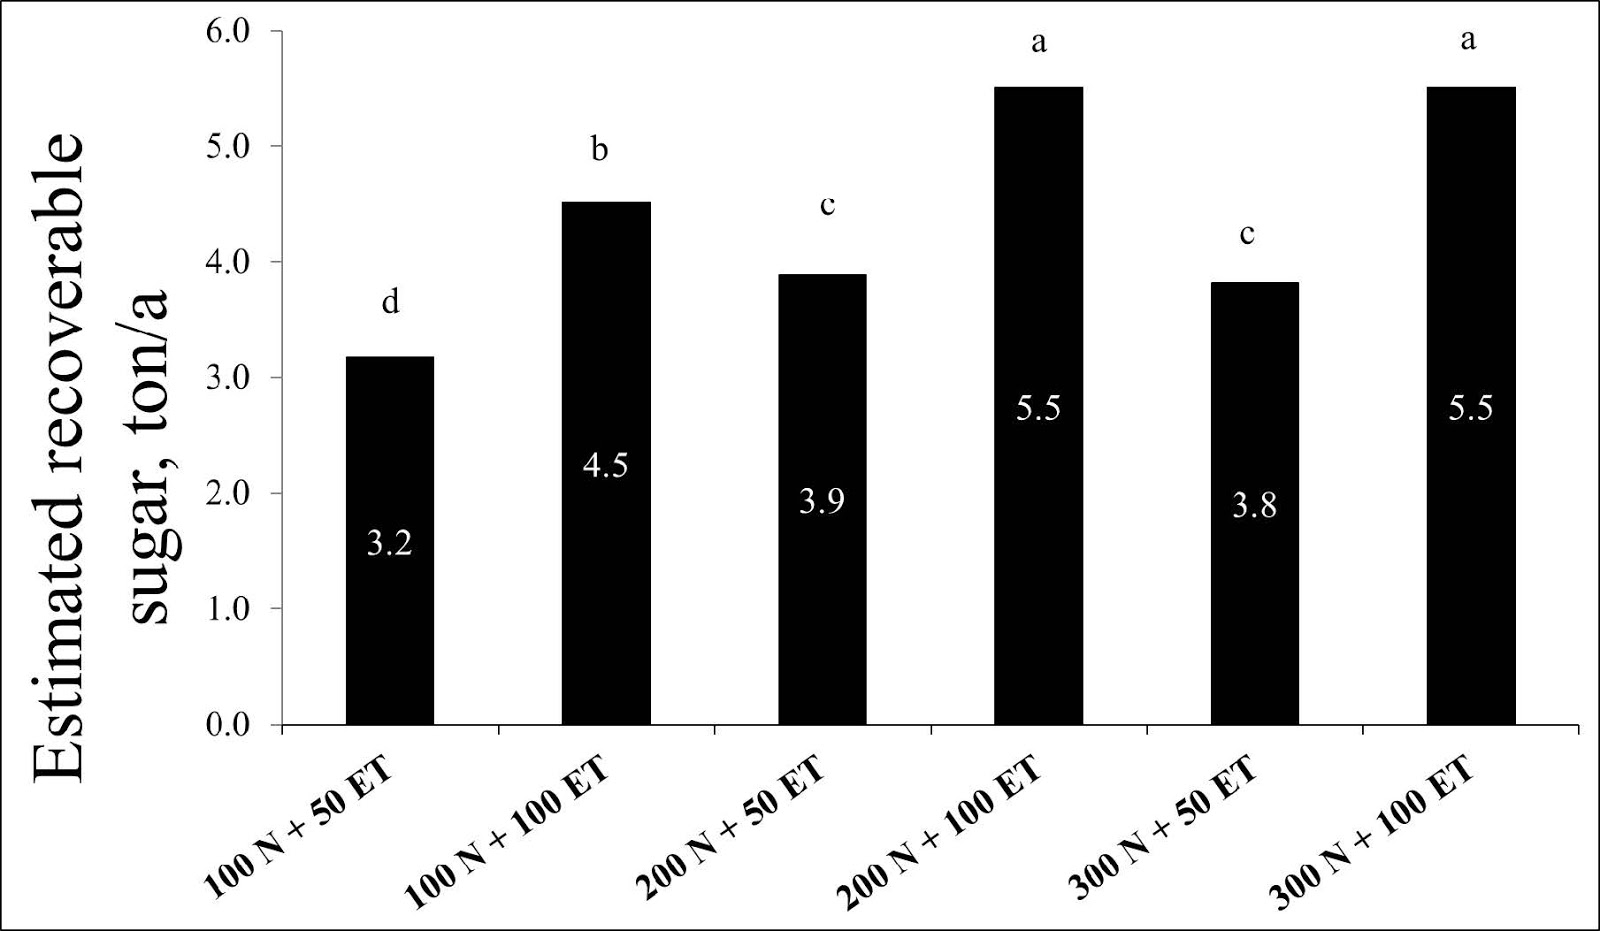
Estimated recoverable sugar (combination of sugar beet root yield and sugar content) was maximized with 200 N + 100 ET; as with yield, increasing N rate to 300 kg ha-1 did not further enhance estimated recoverable sugar.
Early season biomass N content and plant height was strongly positively correlated with sugar content.

Subscribe to:
Posts (Atom)